Iometer: Understanding the Results
We are all familiar with the typical "benchmark" score that is the product of many popular performance benchmarks on the market today. Typically, these benchmarks put hardware through a series of tests, count the amount of time needed to complete these tests, compares this time to a baseline time, and outputs one pretty number said to represent the performance of the hardware. Iometer is a synthetic benchmark and the way it reports performance is a bit different.
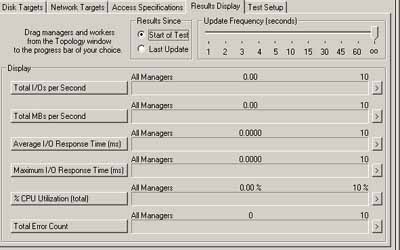
Iometer is capable of describing many aspects of not only disk performance but also network performance. For our purposes, only 4 numbers that Iometer reports at the end of a run are necessary to describe the performance of a RAID array. These numbers are: total I/O per second, total MBs per second, average I/O response time, and CPU utilization.
The total I/O per second label describes exactly what this number is a measure of. This score is a measure of the number of I/O requests completed per second. Since an I/O request is made up of moving the hard drive head to the proper location and then reading or writing a file, this number provides and excellent measure of how a drive or an array is performing.
The next number, total MBs per second, is directly related to the total I/O per second number since the number is produced by taking the number of I/O operations per second and multiplying them by the size of the file being written or read. Once again, this number is very useful when evaluating performance.
The average I/O response time number increases as the number of outstanding I/Os the test is set to have increases. The two do not increase in a linear fashion and measuring the average I/O response time is a good indication of how various RAID cards can handle load.
As for the next number, CPU utilization, the meaning of this number should be fairly clear. Iometer measures CPU utilization in percent and typically the lower the percent CPU utilization, the better.


2 Comments
View All Comments
kburrows - Thursday, December 4, 2003 - link
Have you run any tests on any onboard RAID solutions for RAID 0 & 1? I would love to see the results posted for the new SATA RAID on the Intel 875 boards.Anonymous User - Sunday, August 17, 2003 - link
In adressing the performance of an raid array with different stripe sizes, you miss an important factor, namely the accestime of an disk. This wait time has two main couses. First the head positioning and second the rotational latency (the heads track the right trace, but position where the read start has not passed under the head). You may have to wait from 0 to (in the worst case) a full cycle.Since the disks move independently You can calculate that the average latency to get an small file is minimal when the stripe size is about an full cycle of an disk in the array (aprox. 250kB today). All other factors I do know do not reduce this. (controller overhead, transport,...)
So I think that today a minimum stripe size of 256kB should be used.